Observability
In this guide, we'll start with the Hello World example from the AI JSX template and iteratively add logging.
import * as AI from 'ai-jsx';
import { ChatCompletion, SystemMessage, UserMessage } from 'ai-jsx/core/completion';

function App() {
  return (
    <ChatCompletion>
      <SystemMessage>You are an agent that only asks rhetorical questions.</SystemMessage>
      <UserMessage>How can I learn about Ancient Egypt?</UserMessage>
    </ChatCompletion>
  );
}

console.log(await AI.createRenderContext().render(<App />));
This produces no logging.
Console Logging of LLM Calls
To log to the console, set the AIJSX_LOG environment variable to the desired log level (for example "info" or "debug").
AIJSX_LOG=debug node ./my-ai-jsx-program.tsx
Now you should see JSON log events written to the console, such as
{
  "level": 20,
  "time": 1686758739756,
  "pid": 57473,
  "hostname": "my-hostname",
  "name": "ai-jsx",
  "chatCompletionRequest": {
    "model": "gpt-3.5-turbo",
    "messages": [
      { "role": "system", "content": "You are an agent that only asks rhetorical questions." },
      { "role": "user", "content": "How can I learn about Ancient Egypt?" }
    ],
    "stream": true
  },
  "renderId": "6ce9175d-2fbd-4651-a72f-fa0764a9c4c2",
  "element": "<OpenAIChatModel>",
  "msg": "Calling createChatCompletion"
}
To view this in a nicer way, pipe the console output to pino-pretty:
AIJSX_LOG=debug node ./my-ai-jsx-program.tsx | npx pino-pretty
pino-pretty has a number of options you can use to further configure how you view the logs.
You can use grep to filter the log to just the events or loglevels you care about.
You may also specify a file for log events as well by putting a path after level, separated by ':' character:
AIJSX_LOG=debug:/tmp/ai-jsx.log node ./my-ai-jsx-program.tsx
Now logs will be appended to /tmp/ai-jsx.log.
Fully Custom Logging
Pino is provided above as a convenience. However, if you want to implement your own logger, you can create a class that extends LogImplementation. The log method on your implementation will receive all log events:
/**
 * @param level The logging level.
 * @param element The element from which the log originated.
 * @param renderId A unique identifier associated with the rendering request for this element.
 * @param metadataOrMessage An object to be included in the log, or a message to log.
 * @param message The message to log, if `metadataOrMessage` is an object.
 */
log(
  level: LogLevel,
  element: Element<any>,
  renderId: string,
  metadataOrMessage: object | string,
  message?: string
): void;
A custom LogImplementation can be passed to createRenderContext via the logger option:
AI.createRenderContext({ logger: new CustomLogImplementation() });
When using NextJS, instead of specifying a logger in createRenderContext, you can pass one to the props of your <AI.JSX> tag.
Producing Logs
The content above talks about how you can consume logs. In this section, we'll talk about how they're produced.
Logging From Within Components
Components take props as the first argument and ComponentContext as the second:
function MyComponent(props, componentContext) {}
Use componentContext.logger to log;
function MyComponent(props, { logger }) {
  logger.debug({ key: 'val' }, 'message');
}
The logger instance will be automatically bound with an identifier for the currently-rendering element, so you don't need to do that yourself.
Creating Logger Components
This is an advanced use case.
Sometimes, you want a logger that wraps every render call for part of your component tree. For instance, the OpenTelemetryTracer creates OpenTelemetry spans for each component render. To do that, use the wrapRender method:
/**
 * A component that hooks RenderContext to log instrumentation to stderr.
 *
 * @example
 *    <MyTracer>
 *      <MyComponentA />
 *      <MyComponentB />
 *      <MyComponentC />
 *    </MyTracer>
 */
function MyTracer(props: { children: AI.Node }, { wrapRender }: AI.ComponentContext) {
  // Create a new context for this subtree.
  return AI.withContext(
    // Pass all children to the renderer.
    <>{props.children}</>,

    // Use `wrapRender` to be able to run logic before each render starts
    // and after each render completes.
    ctx.wrapRender(
      (r) =>
        // This method has the same signature as `render`. We don't necessarily
        // need to do anything with these arguments; we just need to proxy them through.
        async function* (ctx, renderable, shouldStop) {
          // Take some action before the render starts
          const start = performance.now();
          try {
            // Call the inner render
            return yield* r(ctx, renderable, shouldStop);
          } finally {
            // Take some action once the render is done.
            const end = performance.now();
            if (AI.isElement(renderable)) {
              console.error(`Finished rendering ${debug(renderable, false)} (${end - start}ms @ ${end})`);
            }
          }
        }
    )
  );
}
This technique uses the context affordance.
OpenTelemetry Integration
OpenTelemetry is an open source observability framework that is supported by a number of vendors.
AI.JSX includes an integration with OpenTelemetry to trace rendering. To enable it, set the AIJSX_ENABLE_OPENTELEMETRY environment variable to 1. When enabled,
Spans are emitted for each async component and capture:
- The input and output of each element
- Dependencies between elements
- The latency of each element
To trace both async and synchronous components, set the AIJSX_OPENTELEMETRY_TRACE_ALL environment variable to 1.
Logs are automatically emitted to OpenTelemetry as well.
To learn more about configuring or deploying an OpenTelemetry collector, see the Getting Started page. The examples project has a sample as well.
Weights & Biases Tracer Integration
Requires an API key from Weights & Biases. Check out their docs for more information.
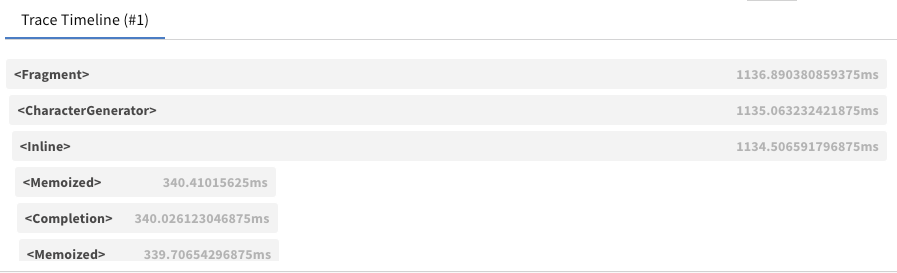
W&B Prompts provides a visual trace table that can be very useful
for debugging.
You can use W&B Prompts by wrapping your top-level component in a
<WeightsAndBiasesTracer>
as follows:
import { wandb } from '@wandb/sdk';

await wandb.init();

console.log(
  await AI.createRenderContext().render(
    <WeightsAndBiasesTracer log={wandb.log}>
      <App />
    </WeightsAndBiasesTracer>
  )
);

await wandb.finish();
There are multiple things happening, so let's break them down:
- Make sure to call
wandb.init()andwandb.finish()before and after rendering the tracer; - The whole
<App />is wrapped with a<WeightsAndBiasesTracer>to which we pass thewandb.logfunction; - By using
await, we make sure thatwandb.initis run first, and then the app render finishes before callingwandb.finish.
Note: Be sure to set WANDB_API_KEY: as an env variable for Node.js apps and via sessionStorage.getItem("WANDB_API_KEY") for browser apps. See https://docs.wandb.ai/ref/js/ for more info.
An example is also available at packages/examples/src/wandb.tsx, which you can run via:
yarn workspace examples demo:wandb